
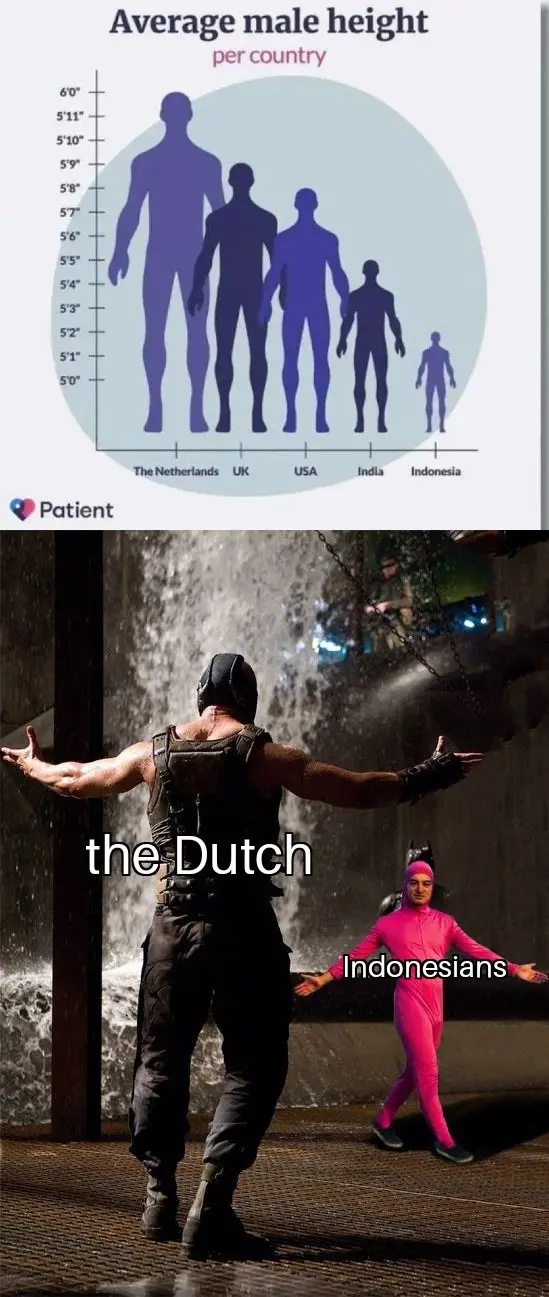
Alt text: Chart showing average height, but incorrectly scales the entire person instead of just the height, with the Netherlands as the tallest and Indonesians as the shortest. Bottom image is the Bane vs. Pink guy meme showing Bane as the Dutch and Pink guy as the Indonesians.
I’m confused. Wouldn’t that support the theory?
If lower in ethnic diversity and native Indonesians are naturally short then Indonesia would be shorter on average. Whereas the US, being such a melting pot, would have a greater range of heights bringing the overall average down, right?
If anything it says with increasing diversity height gets closer to global average which seems pretty reasonable.
Isn’t global male height supposed to be about 5’ 7" on average? The closest to that on the graph is the US, which has a very diverse population.
I’m still not understanding your original comment “Not necessarily. Ethnic diversity is higher in US than in Indonesia.”
It seems like you’re saying ethnic diversity isn’t necessarily a consideration in why the heights of the UK and US are where they are but then support the theory with the next sentence pointing out the ethnic diversity of the US.
The original comment says in NL height is more cause lack of diversity. J meant that’s not necessarily the case (ie lack of diversity =/=> taller).
Ok, so I understand that but how does this fit in:
In the US, a country with greater ethnic diversity than Indonesia, the height is close to the global average, whereas in Indonesia it is significantly below. Correlation ≠ Causation but that statement does more to support the idea that ethnic diversity plays a role than it does to dispute it.
Same here. With increasing diversity (e.g. the US) height gets closer to global average versus a country with less diversity (“diversity is higher in US than in Indonesia”) where the average height is likely more representative of strictly ethnic Indonesians.
Again, I understand Correlation ≠ Causation but that’s why I posted my comment as a question rather than a statement. That maybe this graph is skewed because it fails to account for that diversity and instead of going by country it would make more sense to go by ethnic background?